01 — The problem
Four dashboards open, and you're still typing kubectl to find the answer.
Every team stitches together the same stack to watch Kubernetes. Four tools and one incident later, the root cause still isn't on any of their screens.
01PrometheusScrapes everything, explains nothing.Endless time-series, zero context.
02DashboardsLooked great in the demo.A dozen panels later, no clarity.
03AlertsThe noise keeps growing.Too many alerts, not enough answers.
04kubectlFour tabs open. Still guessing.You end up piecing it together by hand.
02 — The solution
One screen. Every signal. Already explained.
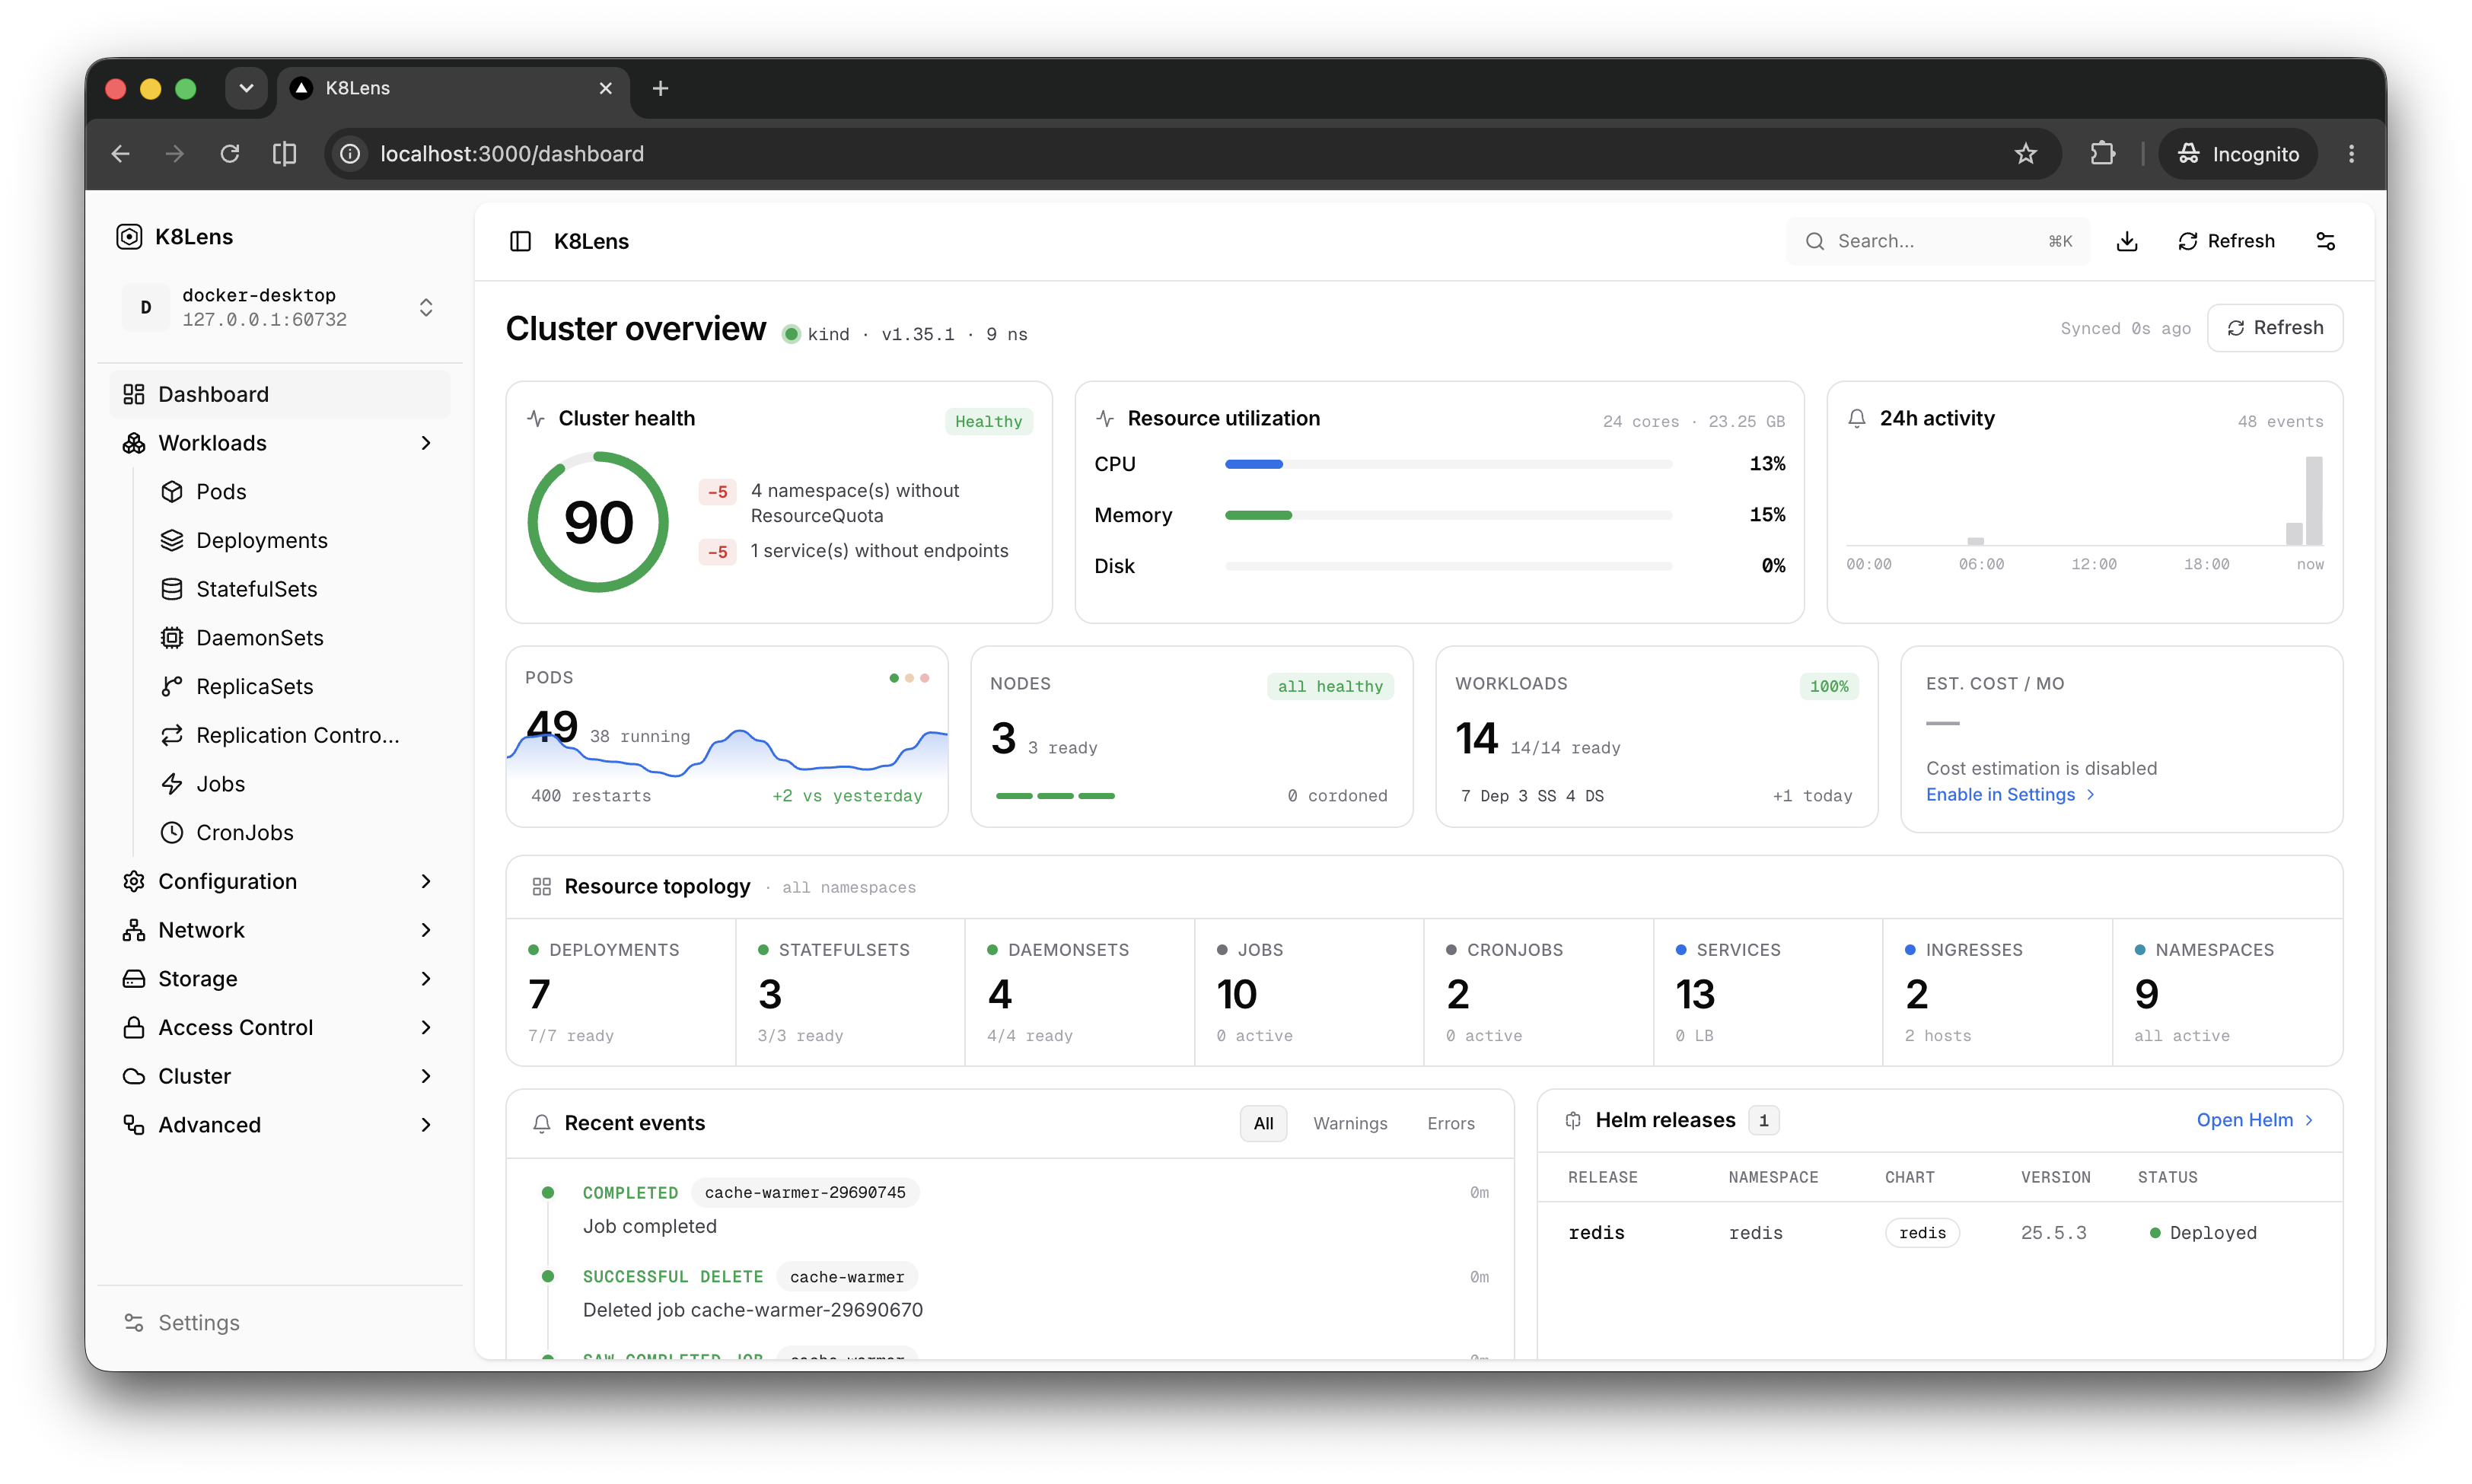
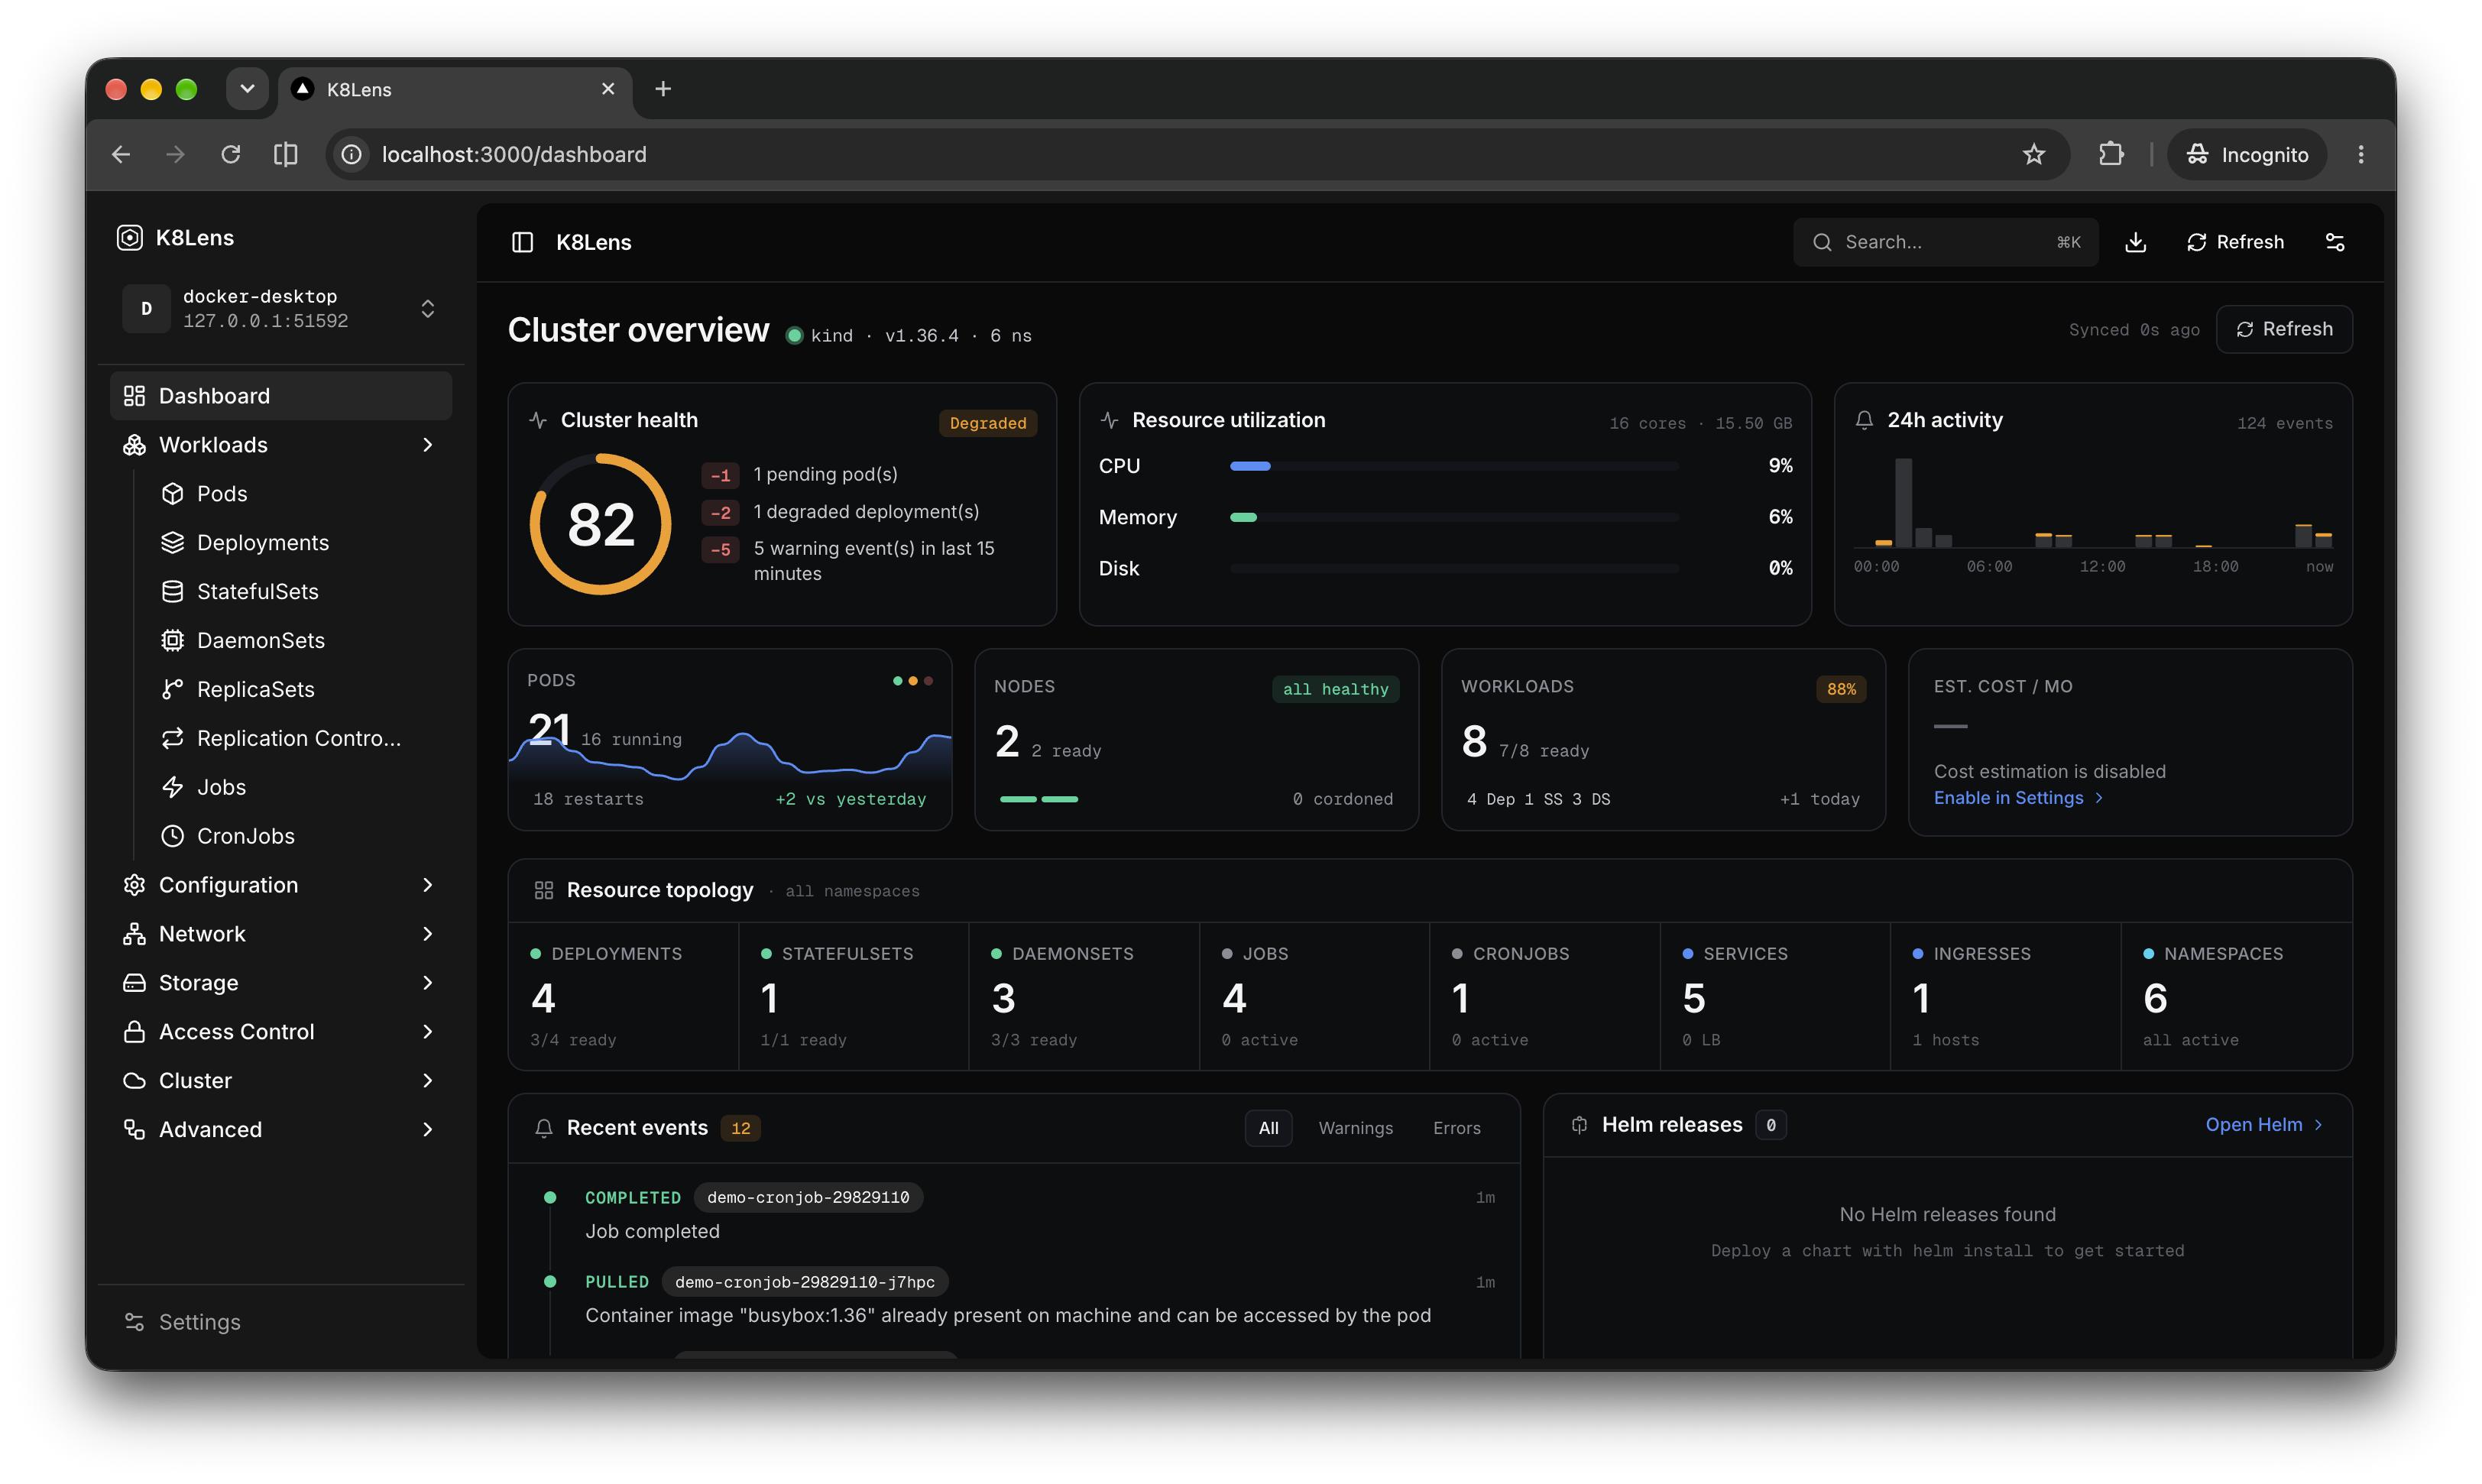
Plug in a cluster and metrics, logs, events, deploys, and cost land on one screen. When something breaks, K8Lens has already worked out why.
03 — What it does
Everything you need to understand your cluster, in one place.
Metrics, logs, events, topology, and more — without changing how you run Kubernetes.
Built-in metrics
CPU, memory, disk and more from the Metrics Server.
Logs & events
Searchable and correlated with workloads.
Topology graph
See how your workloads, services and nodes connect.
Resource explorer
Inspect everything from pods to cluster roles.
Cost insights
Optional AWS cost integration.
Lightweight
Single binary. No extra infrastructure.
04 — How it works
A browser, your kubeconfig, the API server.
No Go backend, no agents, no WebSocket multiplexer. K8Lens is a Next.js app that uses the official Kubernetes JavaScript client to read straight from your cluster.
05 — Open source
Built in the open, kept in the open.
MIT licensed. The roadmap, the design docs and the arguments all live in public issues. There is no enterprise tier holding the good features hostage.
Stop juggling tools. Start trusting one screen.
Get started in under five minutes.
Start monitoring free →
No credit card. Works with any cluster.